Week two:

For me, this week’s readings jumpstarted my thinking about the projects we will be generating over the course of the semester. While we’ve spent some time talking about the organization and structure of webpages in other classes, I’m looking forward to taking it a step further and testing out these ideas.

There are a lot of examples of poor web design available. (My bank has a particularly terrible webpage.)  However, identifying poor design depends on how users evaluate them. I complained about this last semester, but in celebration of a 150 year history my alma mater put together a very pretty and very ineffective timeline that showcases images and content. While it’s “pretty” and “showcases information” – it is also useless. Users can click on the highlighted events to view images or read content, but the experience ends there. There are few links to sources or lengthy descriptions and there’s no opportunity for additional interaction with historical content or other users. A redesign of the site would take into account the arguments in this week’s reading: form AND content matter. As Norman argued, an attractive and pleasant user interface improves the experience of users- but so does intelligent and careful design (Elish and Trettien).

What does it mean that people evaluate aesthetics rather than content or effectiveness in using web pages (Web Credibility)? It means we have to think carefully about how we put pages together- so that they are both pretty and useful.

This week I commented on Sara’s Blog and in my own comments below.

Spring Semester in Research and a THATCamp Challenge

(This post was created in the Spring of 2014 as part of a collective project undertaken by the 2013-2014 cohort of Digital History Fellows at RRCHNM. Each of the subsequent posts (written by individual fellows or collectively) originally appeared at the Digital History Fellowship Blog. These posts have been added to my blog to provide an comprehensive representation of the project. When these posts were written by others, I have noted the authorship.)

The spring semester is here and the first year DH fellows have begun our rotation into the Research division of CHNM.

To get the ball rolling, we spent a week working through the helpful tutorials at the Programming Historian. As someone new to DH, with admittedly limited technical skill and knowledge, these were immeasurably useful. Each tutorial breaks content into smaller, less intimidating units. These can be completed in succession or selected for a particular topic or skill. While there is useful content for anyone, we focused our attention on Python and Topic Modeling with the aim of solving our own programming dilemma.

Our central challenge was to extract content across the THATCamp WordPress site to enable us to do some text analysis.

THATCamp, or “The Humanities and Technology Camp”, an unconference begun in 2008 at George Mason University, provides participants with space to collaborate and discuss the intersection of technology and the humanities. In five years there have been 148 THATCamps (Amanda French, THATCamp coordinator, works out the scale and scope of the camp’s impact in a blog post here).

Each THATCamp has their own domain containing various posts about the event, proposals from attendees, and notes from sessions (for example: dc2014.thatcamp.org). While some camps are more active than others, every camp generates a large number of distinct posts. All of that content is uploaded to one multi-site WordPress install. On the backend, every additional THATCamp is given a distinctive number and a brand new set of tables is created (with upwards of 10 tables for each camp). With 148 separate camps (and an additional 32 upcoming camps), that translates into a massive database.

Given the wealth of information available, the THATCamp website offers an attractive opportunity to examine trends in DH discussion. However, there is no effective way for individuals to do so. If one wanted to learn more about the content discussed across multiple THATcamps, he or she could, theoretically, go to each individual page to read the text, but given the sizable amount of posts and the available, a more efficient option is necessary.

The goal of this project is to create a program using MySQL and Python that will allow us to collect the content available on the site and prepare it for further analysis (using tools like MALLET). This will require several steps:

  • access wordpress content which is stored in a MySQL database
    • create python code that logs into the database remotely
  • identify the tables from each THATCamp’s wordpress site within the database.
    • they are labeled sequentially i.e “wp_2_posts”, “wp_3_posts”, ect and interspersed with other tables like “wp_5_terms” and “wp_42_comments”.
  • grab content from each table that contains the blog posts
    • identify the difference between posts, pages, attachments (information found in the “post_type” column) and “publish” or “inherit”
    • query the content so that the script only pulls posts (not pages or attachments) and only published posts (rather than drafts).
  • create a text file of that content and save it
  • loop through the previous steps with each successive table until done.

Essentially, python builds the string using MySQL, drops it into the WordPress content as a query, where it digs around for the correct data until it receives the content back and then saves the file.

After all that content is downloaded, it needs to be cleaned up. Each post may (or may not) contain some stylistic information and deleted/modified posts may produce error messages that require a bit more work. There are two ways to do this: write another program to open each of those text files and strip out tags, then save them again as text files. Or, we can get the first string to work, then add additional scripts that process out the tags before saving the text file. Then the content is ready for analysis using tools like MALLET.
Public Projects: Reflection

The past seven weeks have moved really quickly but I have benefitted a great deal from the time we spent in the Public Projects section of CHNM.

Due to my relatively limited technical skills, this section has proven to be the most challenging thus far. However, with some help, and some pretty detailed instructions, I have been expanding my skill set and feel a lot less intimidated by the tools we work with. There are three main projects on which we focused: testing updates in Omeka, transcribing and revisiting documents at the Papers of the War Department and contributing to and testing the National Mall site.

I have deeply enjoyed them all, especially the sunny morning we spent at the National Mall. Additionally, a great deal of our work overlapped with the theoretical reading and discussions of our coursework as digital history scholars. It is rare for theory and application to be balanced, but that was definitely my experience this semester. I was frequently surprised to find applications of class reading at work and often referred to the work done at CHNM during course discussions.

Public Projects was deeply inclusive for us as fellows. I got a real sense of each of the ongoing projects and I learned a great deal about the collaborative work required to produce the resources described above.

Overall, this semester the fellowship has given me a structured place to develop my knowledge and expertise with digital tools, like Omeka and Scripto, and given me a sandbox to play with Git Hub and the command-line (if you know what those things are, you are in a much better place than I was three months ago!)

I’m looking forward to learning more in the semester to come!

Digital Project: IN PROGRESS

This is definitely, definitely, DEFINITELY rough.. I’ve been completely outside of my comfort zone with this: but picked up some handy new tricks.

There is dummy text in place, and many photos are up from the archival sources – but full citations are missing. My mapping tool is still in the early stages as well.

Deaf-Missions Baltimore

(Note: due to problems with my dataset and a lack of access to location data I’ve changed my final project. My initial plan was to geolocate members of the Christ United Methodist Church for the Deaf in Baltimore during the desegregation of the church and get a sense of the population distribution in the city. I was also interested in how and why the church moved during the the first half of the twentieth century – but I was unable to find data the appropriately investigate these questions.)


Collaboration

The collaborative emphasis of this week’s readings (and our discussion of digital history/humanities this semester) has been one of the most attractive features of work in this field. It serves two of the major concerns I frequently face as a scholar – one, it broadens the field of study – making use of more hands and minds to cast a wider field of study – and two, it centralizes critique and conversation in a way that encourages participation of multiple voices.

Working on a small subject field, with resources scattered in various repositories that are frequently overlooked for categorization or consideration- digital tools and curated digital archives have unlocked a great deal of the hidden histories of people with disabilities. Placing these conversations in public, accessible spaces increases the participation of minority voices. Beyond that, it locates me in a conversation with scholars that challenge my thinking and encourage me to consider my role in the process.

Unfortunately, as I read this week, I was struck by the lack of collaborative digital deaf studies resources. Deaf studies as a field makes use of digital tools – they encourage collaboration, as a rule, but other than a wiki project proposal a few years ago, I haven’t seen any major efforts to cultivate scholarly discussions outside of walled institutions.

We have a digital journal, I’ve mentioned before: the DSDJ, but looking at the resources this week, I thought about the process of peer review that could occur. If videos were uploaded in smaller pieces, commentary were available on the page- enabling participation and dialogue with community members using technology like vialogues – this could make the peer review process more engaging and result in stronger works. I’m thinking of more efforts that could be made to enhance the use of the DSDJ as a tool and a resource – it might be worthwhile to send them an email and see if they could do something similar for at least one article per issue.

Teaching History

This week’s readings were cause for reflection for me. I thought a lot about the ways in which I constructed my courses (and my use of powerpoint). For the most part, I taught the way I learned – with a coursepack of readings and sources, with five page papers and tests that asked you to recall “facts”. But I started to think also about how I had deviated from that – asked my students to take opposing positions and debate their interpretations, required them to make “mashups” of newspaper articles that tackled particular content/concepts, and encouraged them to use digital/analog media to represent change over time. I measured whether or not this was effective by the depth of our discussions as much as their scores on essay questions.

But more than instilling a degree of teaching anxiety, the readings got me to consider more broadly what it means to teach/learn/do history.

Rather than a process of ensuring that students can fill in enough Scantron bubbles to demonstrate that they “learned” something, I liked how Kelly described the act of engaging students as a “tension” , as something that “destabilized their assumptions” (in chapter 1). (Similarly, Wineburg, writes, that historical teaching teaches us “to go beyond our own image, to go beyond our own brief life, and to go beyond the fleeting moment in history into which we’ve been born.” 498) Learning can be remarkably uncomfortable and it can also be challenging and fun. The AHA article reached this point as well- that its less about teaching students what to think, and more about teaching them how to think.

Reformulating teaching practices from these positions forces us to reconfigure how we use the classroom and what sources we use. Rather than approaching “the web” as a barrier teachers have to reach across to impart knowledge to students, “We can think of the web as the untextbook” (AHA “Abundance”), something that destabilizes a rigid teaching approach and encourages us as scholars to consider useful and effective means to develop historical skills/thought in our students. Perhaps the internet presents an obvious, if not superior, means of doing just that- as McClymer states in the introduction, “On the web there is no scholarly filter.” And as the examples presented by Kelly demonstrate, students should develop the ability to assess and use the abundance of information available.

If nothing else, I agree with Kelly here: “The best way to use digital media to teach them to see history as we see it is to create learning opportunities that make it possible for our students to do history—to practice it as we practice it—to help them make history, using their own creative impulses, rather than simply giving us what they hope is the correct answer to a question we have posed.”


Playing with the Google Ngram Viewer

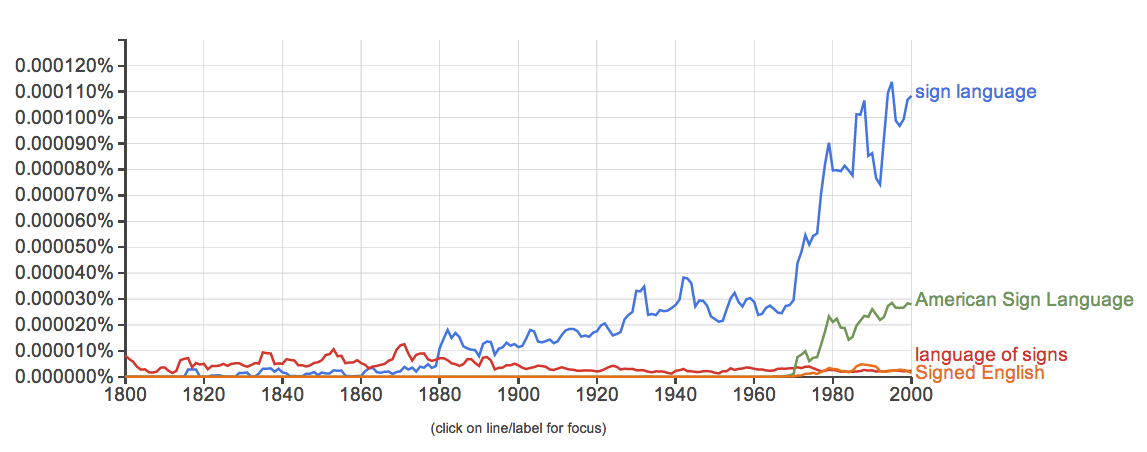
I’ve been playing with the Google ngram viewer. I wanted to test it’s features and the best way to test it was to use terms from my area of research.

I got some typical responses:

Image

In this chart, there are no real surprises. The comparison of terms demonstrates the changes in how sign language was described – in the nineteenth century, “language of signs” was the accepted phrasing, the sharp growth of “sign language” corresponds with what we know about the rise of oralism, and American Sign Language is a relatively new term that differentiates ASL from other sign languages.  The introduction of signed systems in the twentieth century – is clear  here as well with the appearance of “Signed English”.

My next chart is a bit more interesting. I wanted to look at changing social perceptions using the Deaf Pride/Deaf President Now movements as key features. DPN was a dramatic, public protest in March 1988. The spike on the graph at this time is clear -but the secondary spike is interesting – clearly, after the event occurred – it became the subject of considerable discussion, though interest has waned. The concept of “Deaf rights” makes an appearance at this time, but does not appear as frequently. “Gallaudet” is difficult to parse out -the spikes don’t align with major events/moments with the university  – I wonder if there is confusion between the place / family name.

Image

The final chart was a look at the growth of phrases of self-identification in the literature:

Image

“Deaf community” is the phrase with the longest history. The growth of it’s usage in the 1960s lines up with the burst of sociological/linguistic study of deaf people as a group. The 1980-90s development of “Deaf culture” makes sense with the Deaf Pride movement and the DPN event – as well as a flurry of texts that adopted cultural/minority perspectives. “Signing people” is a new phrase (as evidenced by the graph).

So, again – no major surprises.

It’s a cool tool – but limiting. I found myself frustrated and wanting to search within a specific corpus of texts (ie books relevant to these subjects). Using specific search terms like “deaf” were ineffective because the word is used largely within literature without describing/pertaining to deaf PEOPLE. It would be cool to be able to look across deaf studies texts/articles/pedagogical materials and identify changing terms in conjunction with larger social changes.

History/Today – Digital Resource

A mock up of the History/Today home screen. On a grey background History is written in a calligraphy, Today is written in a thin, contemporary font. The center in the screen reads Let's get started! Find an image using the buttons below! There are three blue buttons, search, geolocate and choose from existing.
iphone image: source

For historians concerned with the construction of physical space there is a lack of real-time visual comparison tools that allow researchers to juxtapose historical images with contemporary space. To resolve this issue currently researchers may bring analog photographs or use mobile devices to display digital images, however, it is unrealistic to expect people to carry historical objects to the site, nor is the current use of digital images effective. Both approaches continue to be imprecise because static historical images cannot be manipulated or merged with current views in real time. Neither method allows for intensive examination of change or development.

A large image of the Capitol building with the image of an iPhone at an angle on the right. The iPhone screen reveals a search of historical images of the Capitol Building, at the top is a black and white photo of the building under construction.
Background image: source
iphone image: source
Image 1: source
Image 2: source
Image 3: source
Image 4: source
Image 5: source

In response to this problem, I propose that History/Today, a mobile application that superimposes historical images on the camera viewer of your mobile device, will enable access to a great deal more than a single person could carry with them.

Overlaid on an iphone image, a contemporary image of the capitol building is superimposed with a historical image of the building being built. Editing tools appear on the right.
Background image: source
iphone image: source
Overlay image: source

The addition of modification tools facilitates dynamic interaction between viewer, history and space. As a form of augmented reality (AR), History/Today would allow researchers to reconstruct the context in which an image was captured providing for the comparison of contemporary spatial organization and architecture with that which has existed in the past.

Upon opening the app, users would be prompted to make choices about how the program should function. Users may choose images using a search feature (drawing images from a search engines using search terms provided by the user), by allowing the phone’s internal GPS to locate them on a map, or by utilizing an existing photo from their mobile device. In each case users will then choose an image from the populated list. History/Today accesses the phone’s camera and superimposes the selected image on the camera viewer. The interface includes a sidebar that enables the modification of the AR display. In my paper I described each of these features at length, they include: a search function, geolocation function and the choose from existing function for the population of overlay images, these images can be modified by being moved/resized, compared, made more or less transparent, lines blurred or portions of the image can be erased. Following a period of modification, users may then choose to save the composite image they have generated.

Comparison Tool
iphone image: source
Left image: source
Right image: source
Tool Example
iphone image: source
Background image: source
Overlay Image: source
An image of the White House is super imposed with a historical image of an egg hunt. Red squiggly lines appear on the left.
iphone image: source
Background image: source
Overlay image: source

Existing tools and resources have attempted to provide resolution to these problems but do not adequately meet the needs of researchers. In an effort to respond to these concerns, I have added or modified existing technology to better serve the needs of this population. A real-time overlay provides users with greater flexibility and allowing them to capture images that are precise and clearly aligned. Comparison photos are quickly and easily constructed with the click of a button. Harsh boundaries between past and present are mediated using the transparency, blur and erase functions. Further, using erase allows for the selective juxtaposition of past and present with interesting results. Giving users the option of drawing from their own database enables researchers to bring images of interest to the center of their exploration. History/Today should and can be responsive and the application of this tool is limited only by the exploration of its users.